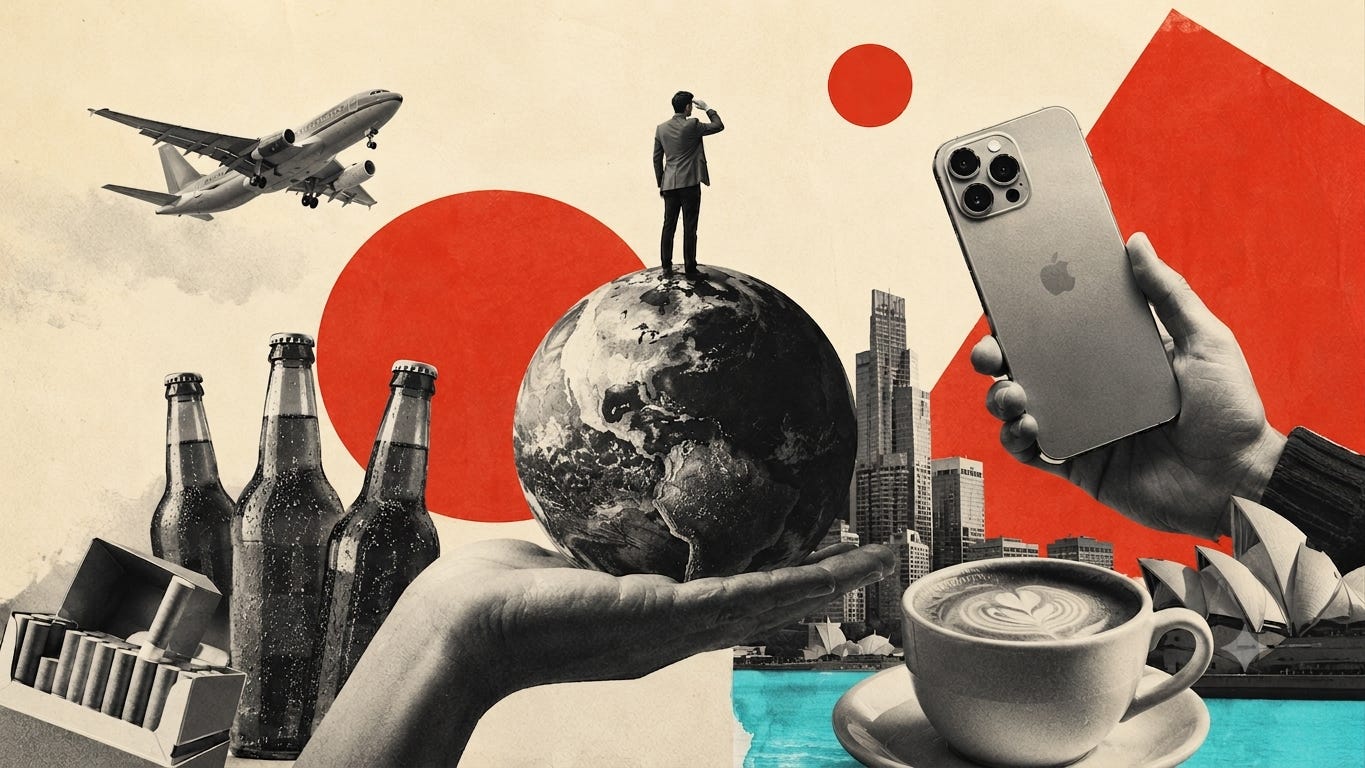
You’ve heard about the Oasis Index, right? Maybe not.
It’s the cost of buying five beers and two packs of cigarettes in 69 cities around the world. The name is a nod to Cigarettes & Alcohol, the 1994 anthem from Oasis’s debut album Definitely Maybe.
It’s an unlikely economic indicator, but, really, an irresistible headline. The Oasis Index is just one measure buried inside Deutsche Bank Research’s annual Mapping the World’s Prices report, an otherwise sober comparison of the cost of living around the globe.
Before we go on … search your next holiday destination now!
Beyond the grog and smokes, we’ve pulled out a handful of the report’s most revealing charts:
Quality of life: The top 10 cities only, making year-on-year changes easier to spot.
Net salary: All 69 cities, showing 2026 earnings alongside the change from 2025.
Disposable income: All 69 cities, comparing this year’s figures with last year’s.
iPhone Index: Apple largely sets its prices globally, so the differences between cities are a useful readout of local taxes, tariffs and currency movements rather than the phone itself.
Compare Australia to the globe
Australia's two major cities post a consistent, if unglamorous, pattern across Deutsche Bank's 2026 rankings: solidly mid-table on quality of life, but climbing on income measures. Melbourne ranks 11th of 69 cities for quality of life (up one place since 2012, though down one since 2019), with Sydney close behind at 14th (down 10 places since 2012 and down two since 2019 — the steepest decline of the pair).
On net salary, Melbourne again leads domestically at 11th globally ($4409 per month, up four ranks on last year) with Sydney at 14th ($4181 per month, also up four ranks).
The clearer gap opens on disposable income after rent, where Melbourne's lower rental burden pushes it to 9th globally ($5,496/month, up three ranks), while Sydney trails well back at 29th ($3,428/month, also up three ranks but starting from a much weaker base). It’s a reminder that Sydney's higher headline salary is substantially eroded by its rent, in a way Melbourne's isn't.
Another ubiquitous product in an ever-shrinking world is the iPhone. Apple largely sets its prices globally, but once local taxes, import duties, tariffs and currency movements are factored in, the price consumers actually pay can vary dramatically.
Türkiye tops the table, where an iPhone costs around 2.2 times the US price, a consequence of the lira’s long slide and hefty government taxes on imported electronics. At the other end of the spectrum, Japan is the cheapest place to buy one, with prices about 5 per cent below those in the United States.
Australia sits somewhere in the middle. An iPhone here costs about 20 per cent more than in the US, reflecting the combined impact of GST, exchange rates and Apple’s regional pricing.
Now, about the coffee comparisons …
As much as we’d have loved to include the report’s coffee index, Sydney and Melbourne weren’t included this year, making Australian comparisons impossible. We now that’s wrong, but we push on.
Still, for the caffeine faithful, here’s how the world stacks up.
Zurich reclaimed the title of the world’s most expensive city for a cappuccino in 2026 at US$7.13, edging Copenhagen (US$6.96) and Geneva (US$6.41). Switzerland’s high wages and strong currency continue to push everyday purchases to the top of the global rankings.
Italian cities remain the developed world’s outlier. A cappuccino in Milan costs just US$2.18, less than one-third of the Zurich price, reflecting both lower operating costs and a café culture where grabbing a quick coffee at the bar is expected to be affordable.
New York, Los Angeles, San Francisco, Dubai, Tel Aviv and Doha also rank among the world’s most expensive cities for coffee, although Deutsche Bank does not publish their exact prices.
Did you miss this?
Chris Hemsworth in Wollongong? well, yes. Get the latest on the draft Illawarra-Shoalhaven Regional Plan but scroll down … and learn more: right here